Audit logs
Audit logs is used to check all the different requests performed to the server.
General
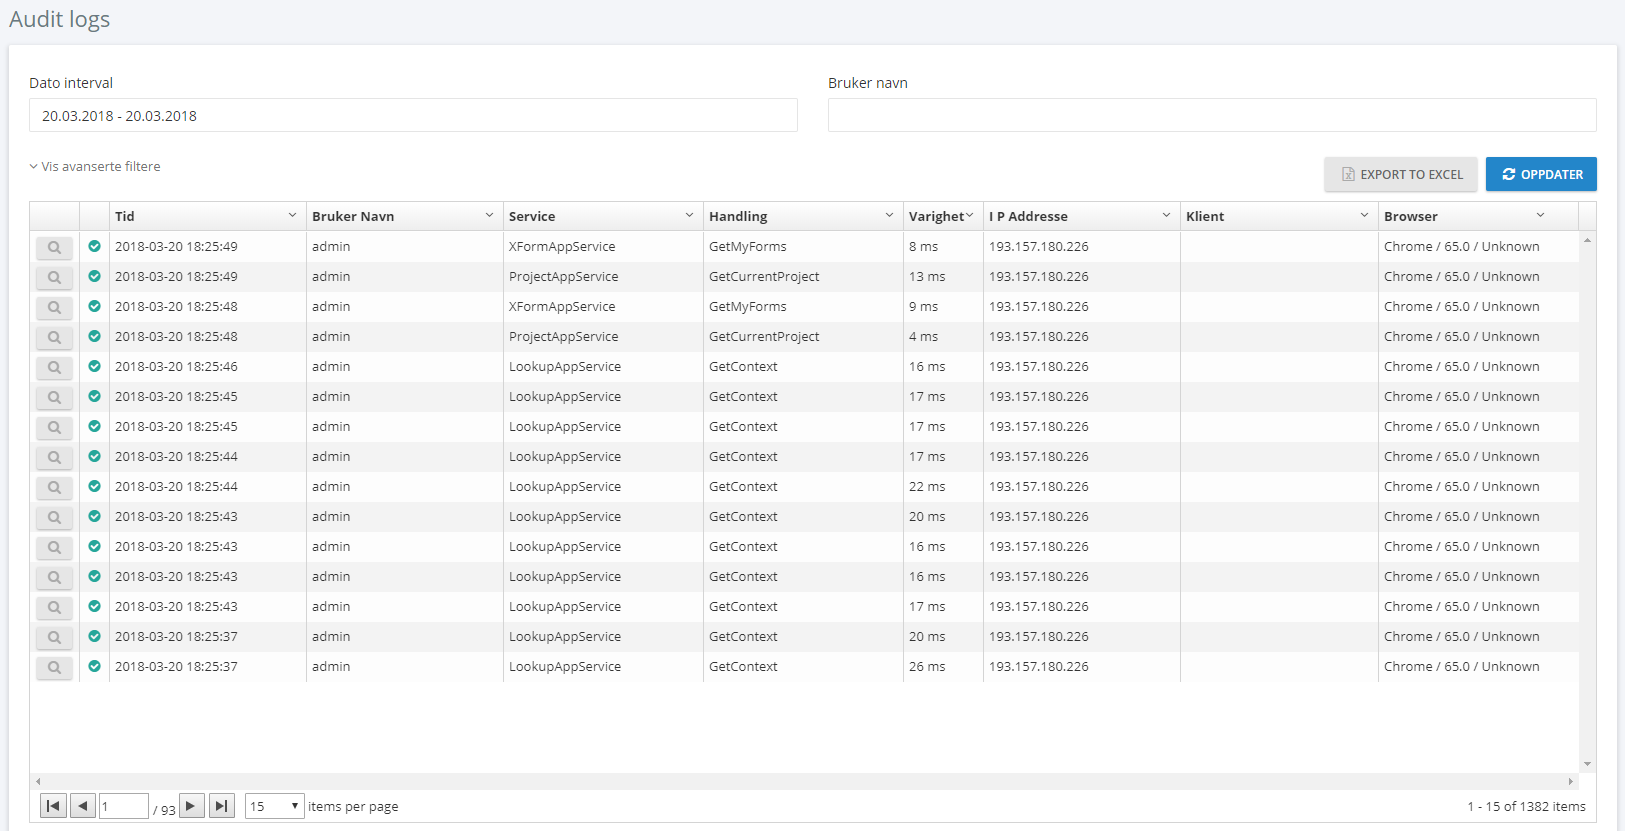
When you navigate to audit logs you get something like this:
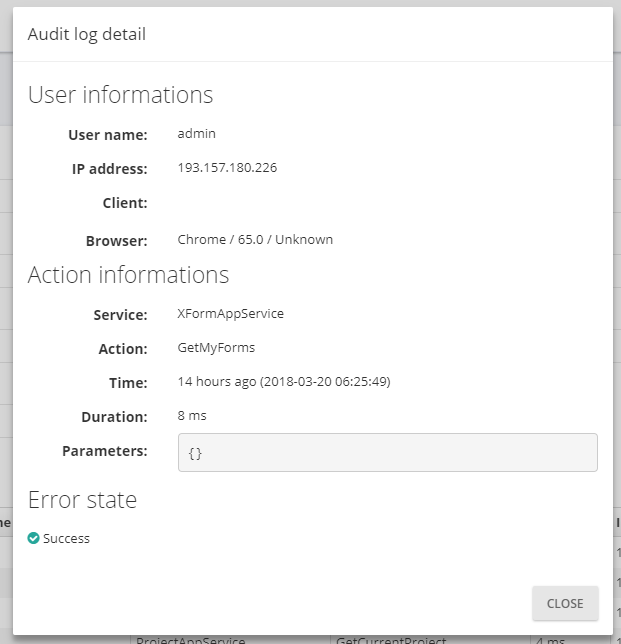
There you can choose an date range and (optionally) filter by user name. The first column shows an icon for showing details. If you click on it you get the following:

Explanation on the other columns below:
| Column | Explanation |
|---|---|
| Error state | Shows  for success and for success and  for error for error |
| Time | The time the request was made |
| User name | The user name of the person that made the request |
| Service | The name of the service that made the request |
| Action | The name of the action the request performed |
| Duration | How long the requst took to finish |
| IP Address | The IP address of the device/computer that made the request |
| Client | ??? |
| Browser | The browser the request was made from |
Filtering
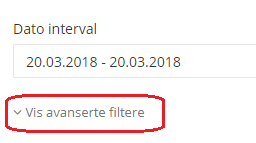
If you click on Show advanced filters:
you get some more options (in addition to date range and user name) for filtering the results:
There you can filter on Service, Action, Browser, Duration (if you leave one of the duration fields blank it treats it as a wild card), Error state. See the table under General for explanation on these columns.
(This documentation page was last updated on 21.03.2018)


